CRI has been the lighting industry's standard language for color rendering for decades.
But a single CRI number cannot tell a designer everything that matters about how a light source will render real materials.
Two LEDs can have the same CCT and nearly identical CRI while producing different color saturation, different red rendering, different hue shifts, and ultimately a different visual experience.
TM-30 provides a much more complete way to understand those differences.
The current ANSI/IES TM-30 method evaluates 99 color samples and provides information about:
overall color fidelity
average color gamut
local chroma changes
hue shifts
differences across individual regions of color space
For architects, lighting designers, and specifiers, TM-30 makes it possible to move beyond a simple question such as:
“Is this CRI 90 or CRI 95?”
and ask the more useful question:
“What does this spectrum actually do to color?”
If you are new to color rendering, start with our High CRI LED Lighting Guide.
Why CRI Alone Is Not Enough
The traditional Color Rendering Index remains useful and widely specified.
Its most familiar value, CRI Ra, represents the average fidelity of eight traditional test color samples.
That provides a convenient headline number, but it has important limitations.
The eight samples represent a relatively limited range of colors, and saturated red — R9 — is not included in the Ra average.
As a result, two sources can both satisfy:
3000K / CRI 95
while having different Spectral Power Distributions and rendering certain materials differently.
This is especially important in environments where color itself is part of the design:
hospitality
museums
galleries
premium residential
retail
cosmetics
material showrooms
food
photography and film
CRI is therefore still useful as a minimum specification, but it should not be treated as a complete description of color quality.
The International Commission on Illumination has also acknowledged this evolution. In 2025, CIE recommended that the lighting community begin transitioning from the traditional General Color Rendering Index Ra toward the newer General Color Fidelity Index Rf, while reporting both during the transition.
TM-30 goes further still by describing not only fidelity, but also how the spectrum changes the gamut and individual hue regions.
What Is TM-30?
ANSI/IES TM-30 is a method for evaluating light source color rendition.
The current version is ANSI/IES TM-30-24.
Unlike traditional CRI Ra, which is based on eight samples, TM-30 uses 99 Color Evaluation Samples, or CES.
These samples represent a much broader and more balanced range of colors.
TM-30 then evaluates how those colors appear under the test source compared with an appropriate reference illuminant.
The method produces several types of information rather than one single score.
The most commonly used are:
Rf — Fidelity Index
How closely, on average, colors under the test source match the reference.
Rg — Gamut Index
How much the average color gamut expands or contracts relative to the reference.
Hue-Specific Metrics
How particular regions of color space change in fidelity, chroma, or hue.
Color Vector Graphic
A visual representation showing where colors become more saturated, less saturated, or shift in hue.
This multidimensional approach is the main reason TM-30 is more useful than simply replacing CRI with another single number.
TM-30 Rf: Color Fidelity
Rf is the TM-30 Fidelity Index.
It measures the average similarity between the appearance of the 99 evaluation samples under the test source and their appearance under the reference source.
A value closer to 100 means higher average fidelity.
In simplified terms:
Higher Rf = colors remain closer to the reference.
Rf is conceptually related to CRI Ra, but it is calculated using a more modern color-science methodology and a substantially broader set of samples.
That makes it a stronger indicator of overall color fidelity.
However, there is an important limitation:
Rf is still an average.
A single average cannot show which particular colors differ.
Two sources with the same Rf may have different behavior in red, green, blue, or other hue regions.
That is why Rf should not simply become the new CRI.
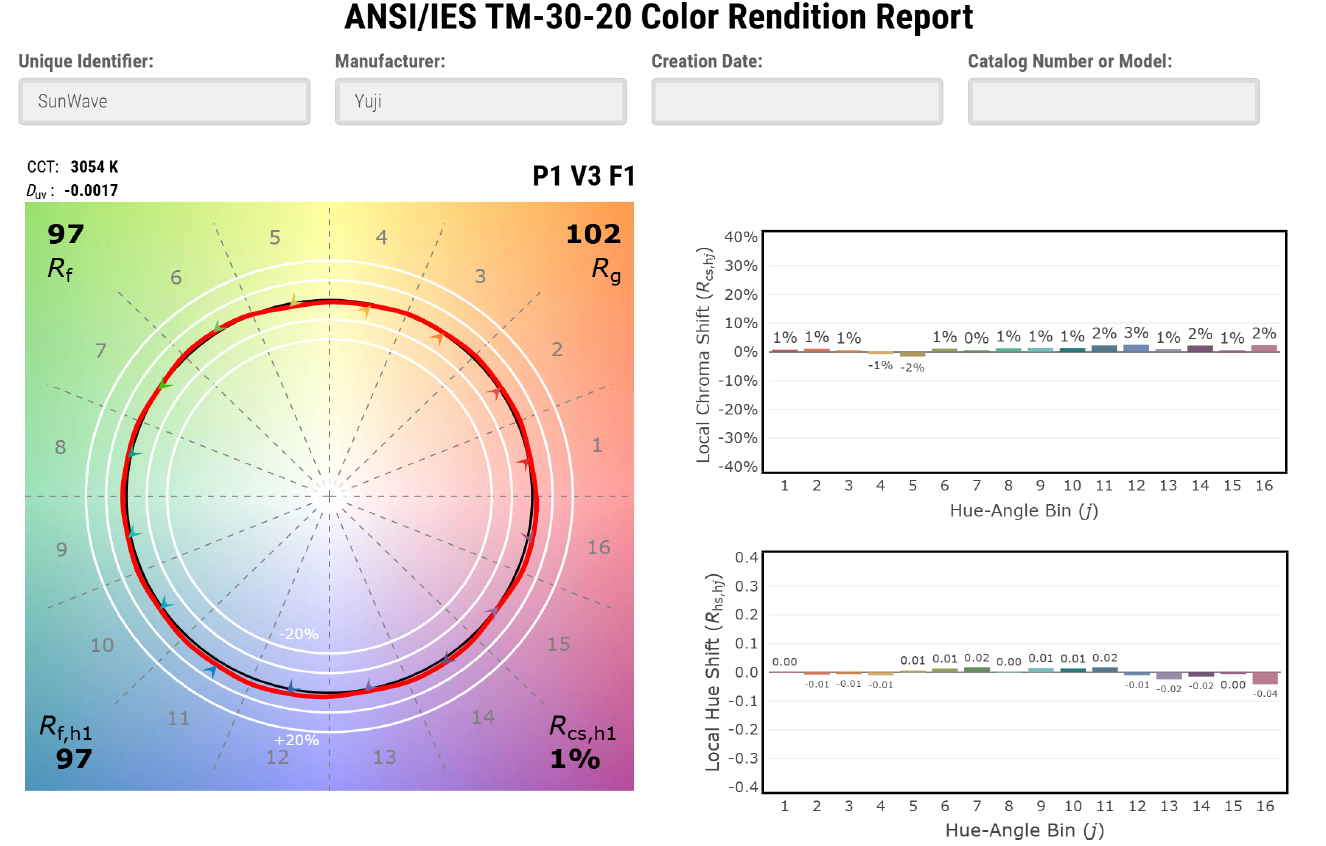
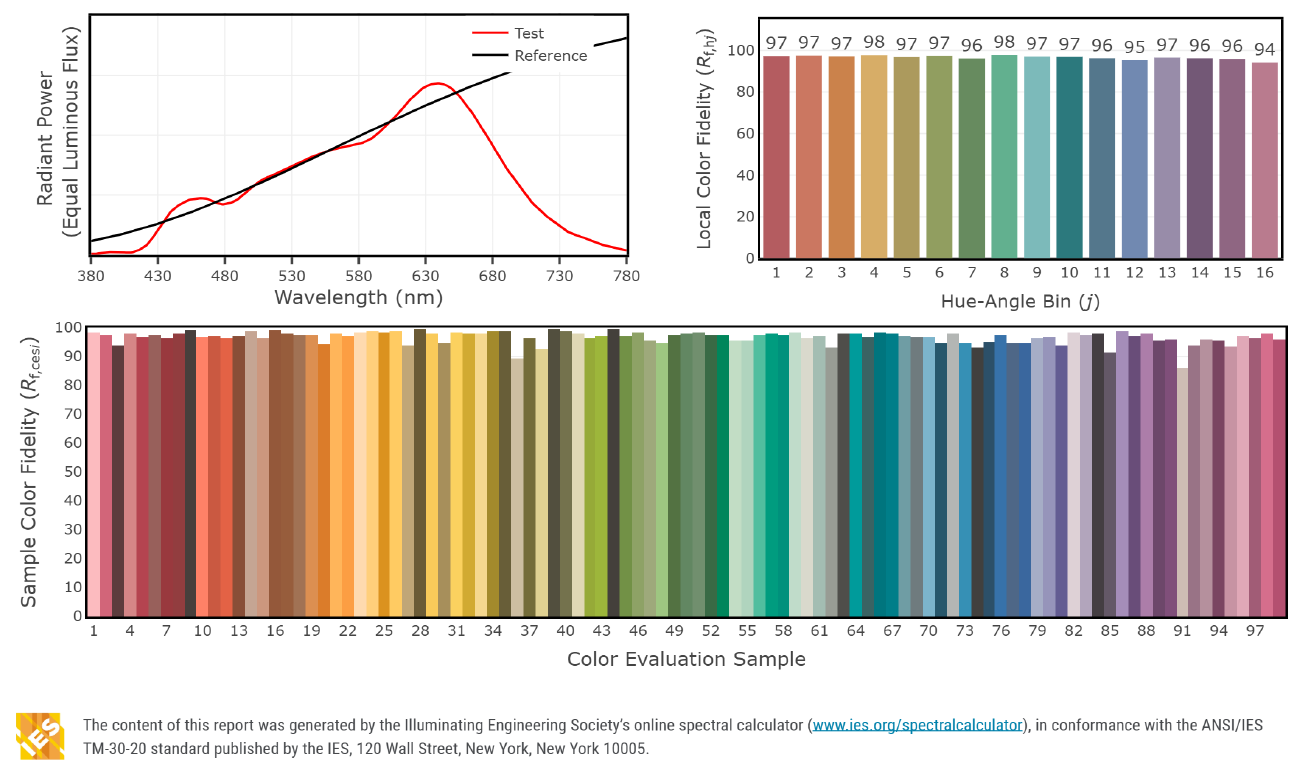
Example of a TM-30 report. Rf summarizes average fidelity, while Rg describes average gamut. The Color Vector Graphic shows where specific hue regions differ from the reference.
TM-30 Rg: Color Gamut
Rg is the TM-30 Gamut Index.
It describes the average change in chroma of the test colors compared with the reference.
A useful simplified interpretation is:
Rg ≈ 100: similar average gamut to the reference
Rg > 100: average chroma is increased
Rg < 100: average chroma is decreased
For example:
Source A
Rf 94
Rg 100
and:
Source B
Rf 94
Rg 107
may have almost identical average fidelity.
But they are not visually equivalent.
Source B produces greater average chroma, meaning some colors may appear more vivid.
This distinction matters because color fidelity and color preference are not the same thing.
In a museum or color-matching environment, close fidelity to the reference may be the primary objective.
In hospitality or retail, controlled increases in chroma may sometimes be desirable.
TM-30 allows the designer to distinguish between those goals.
Is Rg 100 Always Best?
No.
This is one of the most important ideas to understand about TM-30.
Lighting metrics should not automatically be treated as a ranking where the number closest to 100 always means “better.”
An Rg value near 100 means the average gamut is similar to the reference.
It does not necessarily mean that the source will be preferred in every environment.
A restaurant, retail store, luxury residence, museum, and laboratory may have different color-rendering objectives.
For some applications the priority may be:
maximum fidelity.
For others:
high fidelity with modest chroma enhancement.
The correct TM-30 target depends on the design intent.
IES itself distinguishes between different color-rendering intents, including fidelity and preference, rather than treating one metric as universally optimal.
How to Read the TM-30 Color Vector Graphic
The Color Vector Graphic, or CVG, is one of the most useful elements of a TM-30 report.
It shows how the source affects different parts of color space.
TM-30 divides the color space into 16 hue-angle bins.
Each bin represents a range of similar hues.
The graphic compares the average color coordinates under the test source with those under the reference.
At first the chart can look complicated, but the basic interpretation is relatively simple.
When the Test Line Follows the Reference
If the test-source shape stays close to the reference shape, colors in that hue region are rendered with relatively little change.
When the Shape Moves Outward
An outward movement means increased chroma.
Colors within that region may appear more saturated than under the reference.
When the Shape Moves Inward
An inward movement means reduced chroma.
Colors may appear less saturated.
When the Shape Moves Sideways
Tangential movement can indicate a hue shift rather than simply a change in saturation.
This is important because two sources can have almost identical Rf and Rg while shifting individual colors differently.
The Color Vector Graphic therefore answers a question that the headline metrics cannot:
Which colors are changing, and how?
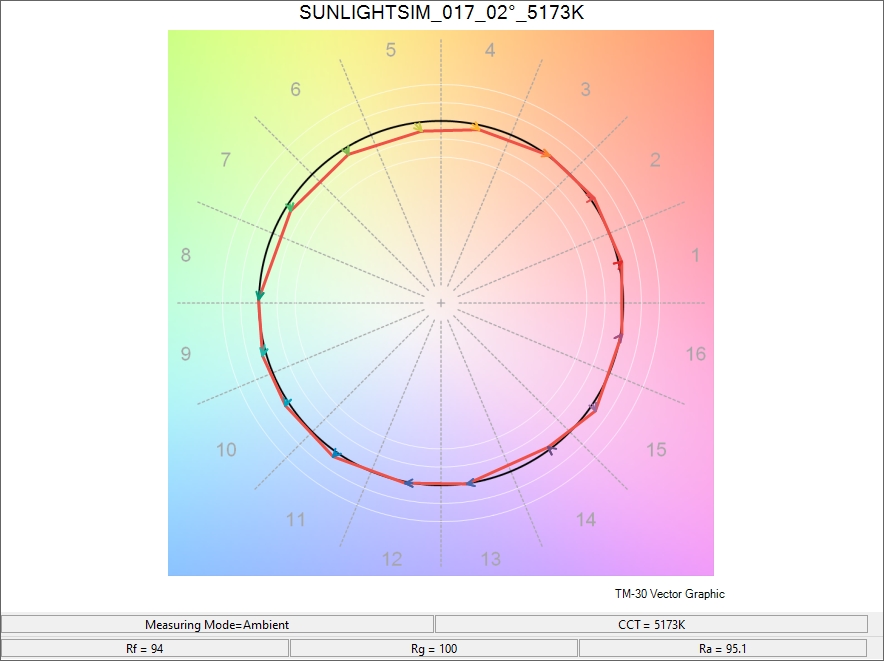
How to read a TM-30 Color Vector Graphic: outward movement indicates increased chroma, inward movement indicates reduced chroma, while directional shifts can reveal changes in hue.
Same CRI Does Not Mean Same Color Rendering
This is where TM-30 becomes especially useful in architectural lighting.
Imagine two products from two manufacturers.
Both specifications say:
3000K
CRI 95
At first glance, they appear equivalent.
But one could have:
Rf 93 / Rg 99
while another has:
Rf 92 / Rg 106
Their Color Vector Graphics may also show very different behavior in red or green regions.
Those sources may create noticeably different impressions when illuminating:
skin
wood
stone
artwork
textiles
food
merchandise
The problem is not that CRI is incorrect.
The problem is that CRI does not contain enough information to describe these differences.
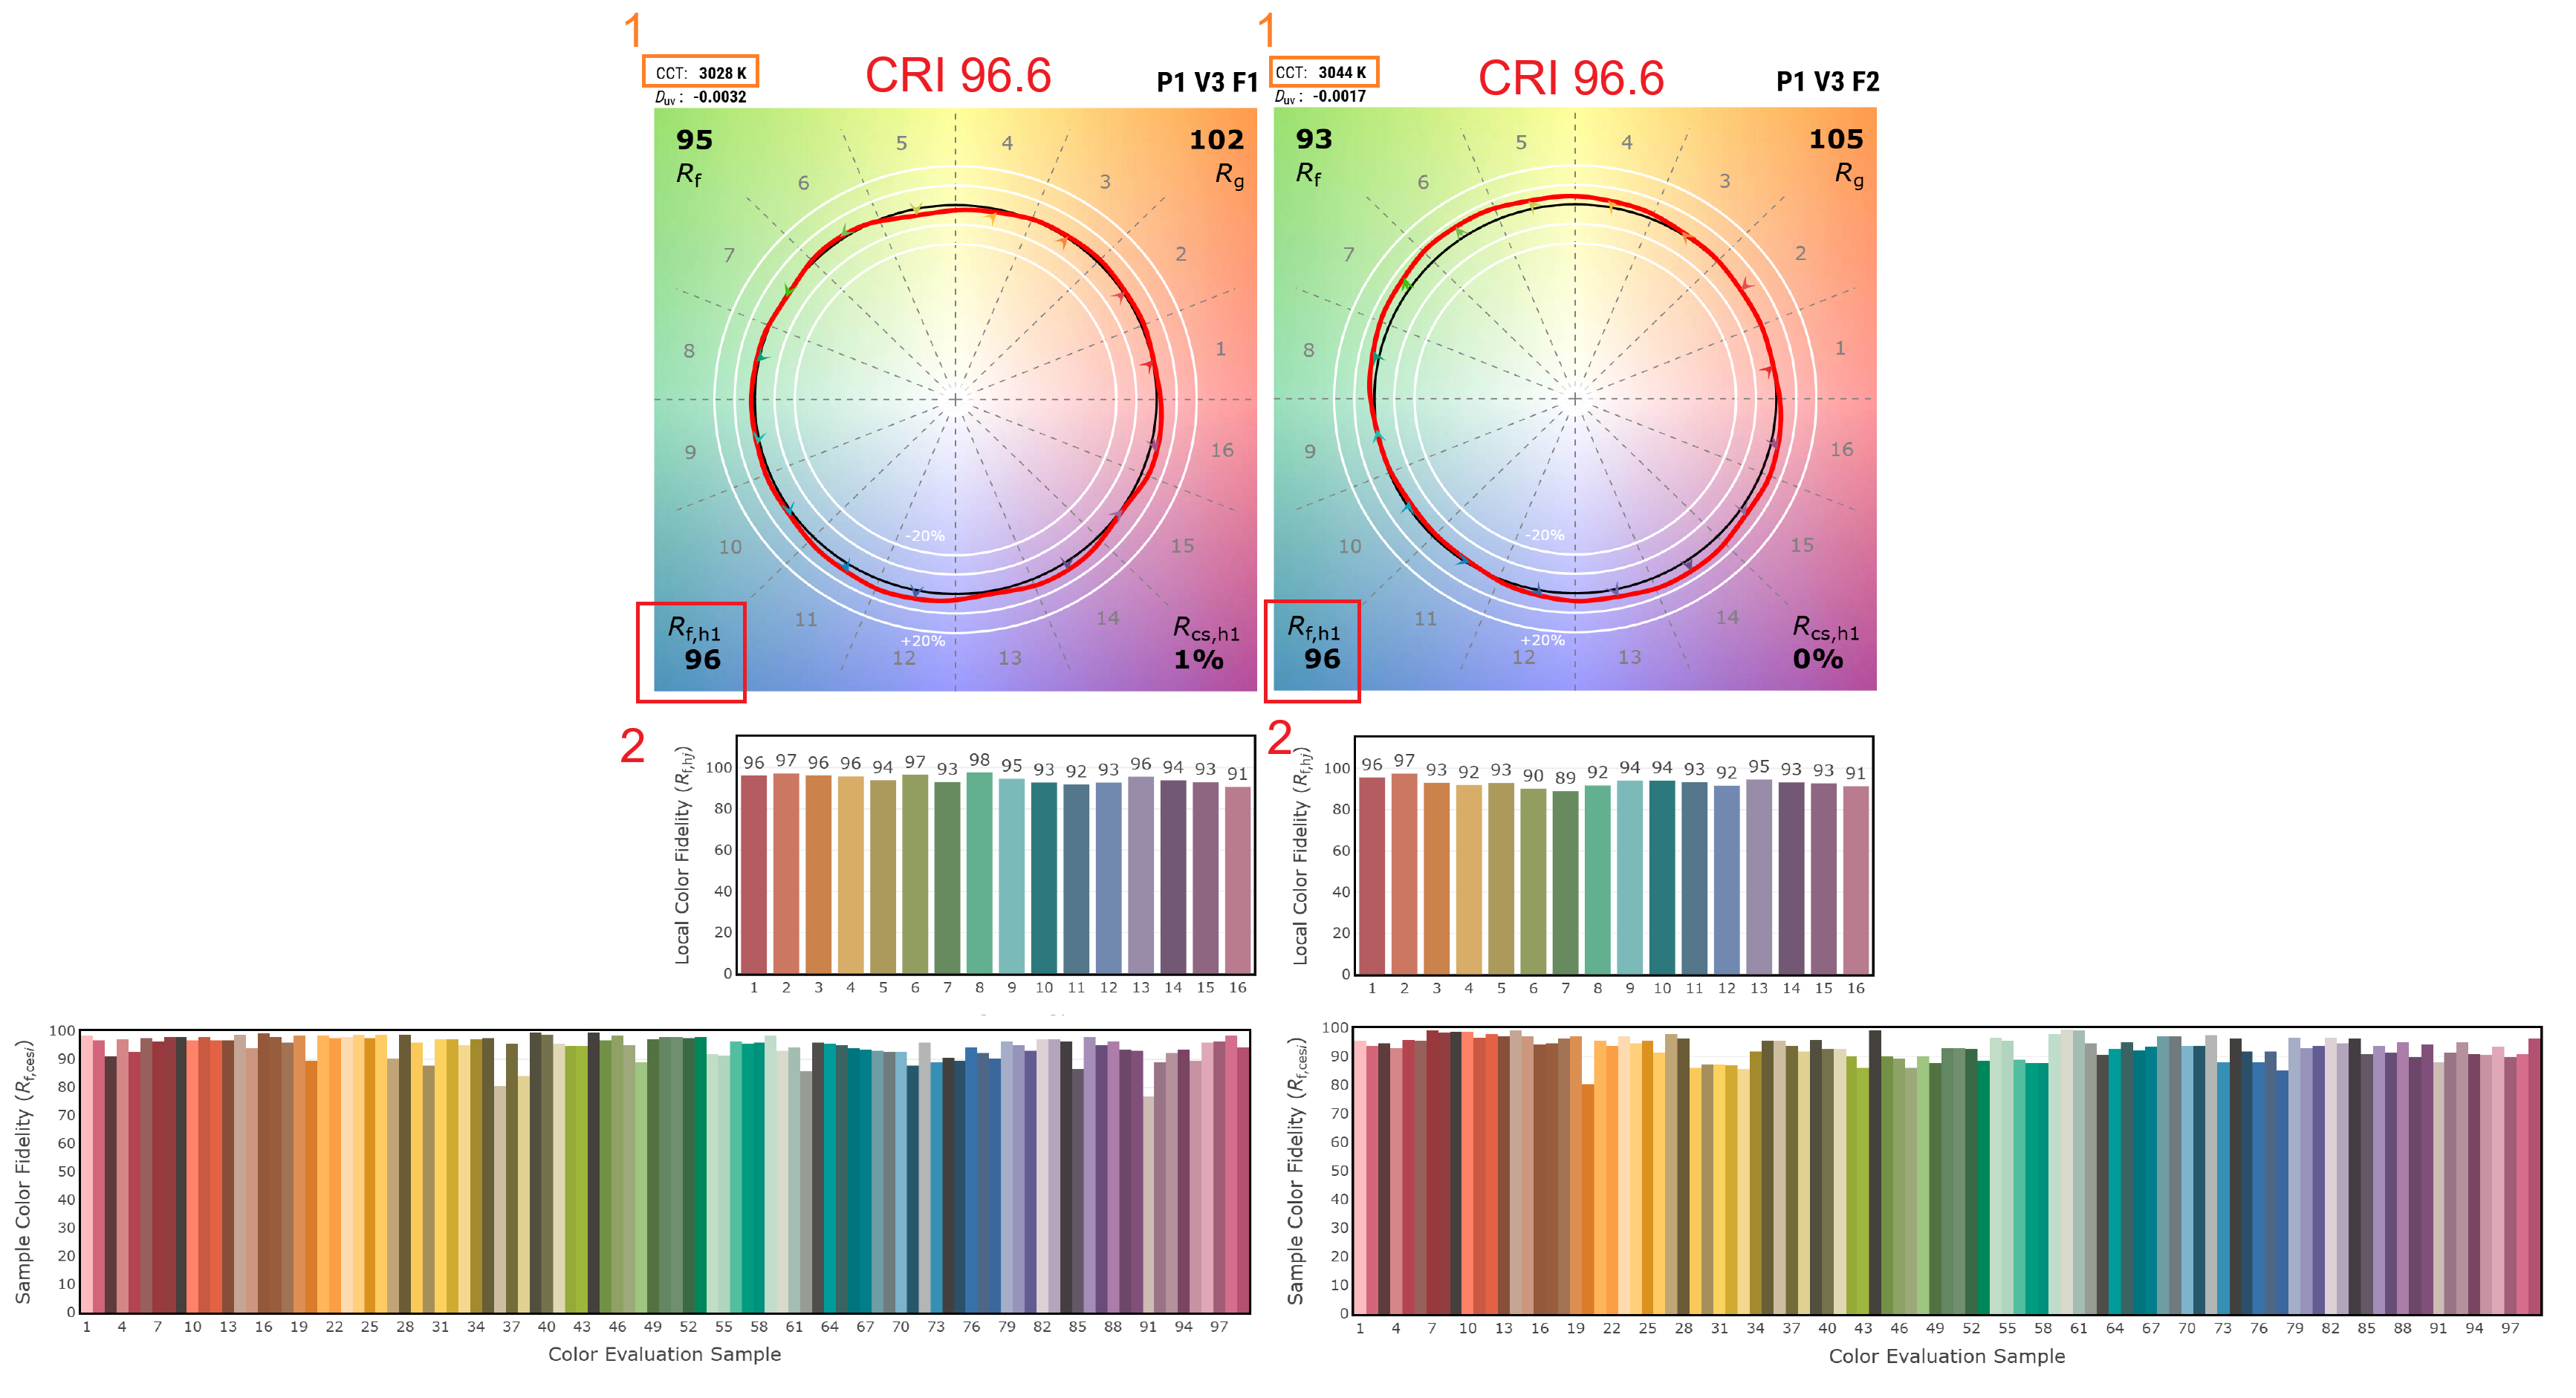
Two Yuji Lux LED strips with the same CRI (96.6) and nearly identical CCT (3028K vs. 3044K) show different TM-30 behavior. Despite identical red-hue fidelity (Rf,h1 = 96), their overall fidelity, gamut, hue-specific fidelity, and individual color-sample performance differ. Same CRI does not mean identical color rendering.
Rf and Rg Are Not Enough Either
TM-30 should not be reduced to a new pair of marketing numbers.
A specification such as:
Rf 95 / Rg 100
provides substantially more information than CRI alone, but it still summarizes complex spectral behavior into two averages.
TM-30 also provides local information about individual hue regions.
These local metrics can show whether the source is:
increasing red chroma
reducing green chroma
shifting yellow hues
changing cyan
affecting one color family more than another
For many general architectural projects, designers may not need to analyze every local metric.
But for color-critical applications, the additional information can be extremely useful.
The key principle is:
the more color-sensitive the project, the less appropriate it becomes to evaluate light with one number alone.
TM-30 and Spectral Power Distribution
TM-30 metrics describe the result of something more fundamental:
the Spectral Power Distribution of the light source.
SPD shows how optical energy is distributed across wavelength.
The spectrum determines how the source interacts with the spectral reflectance of objects.
From that interaction come the color-rendering results measured by:
CRI
R9
Rf
Rg
local chroma shifts
hue shifts
This is why two sources with the same CCT can have different TM-30 results.
CCT tells us the general chromatic appearance of the light itself.
It does not uniquely define its spectrum.
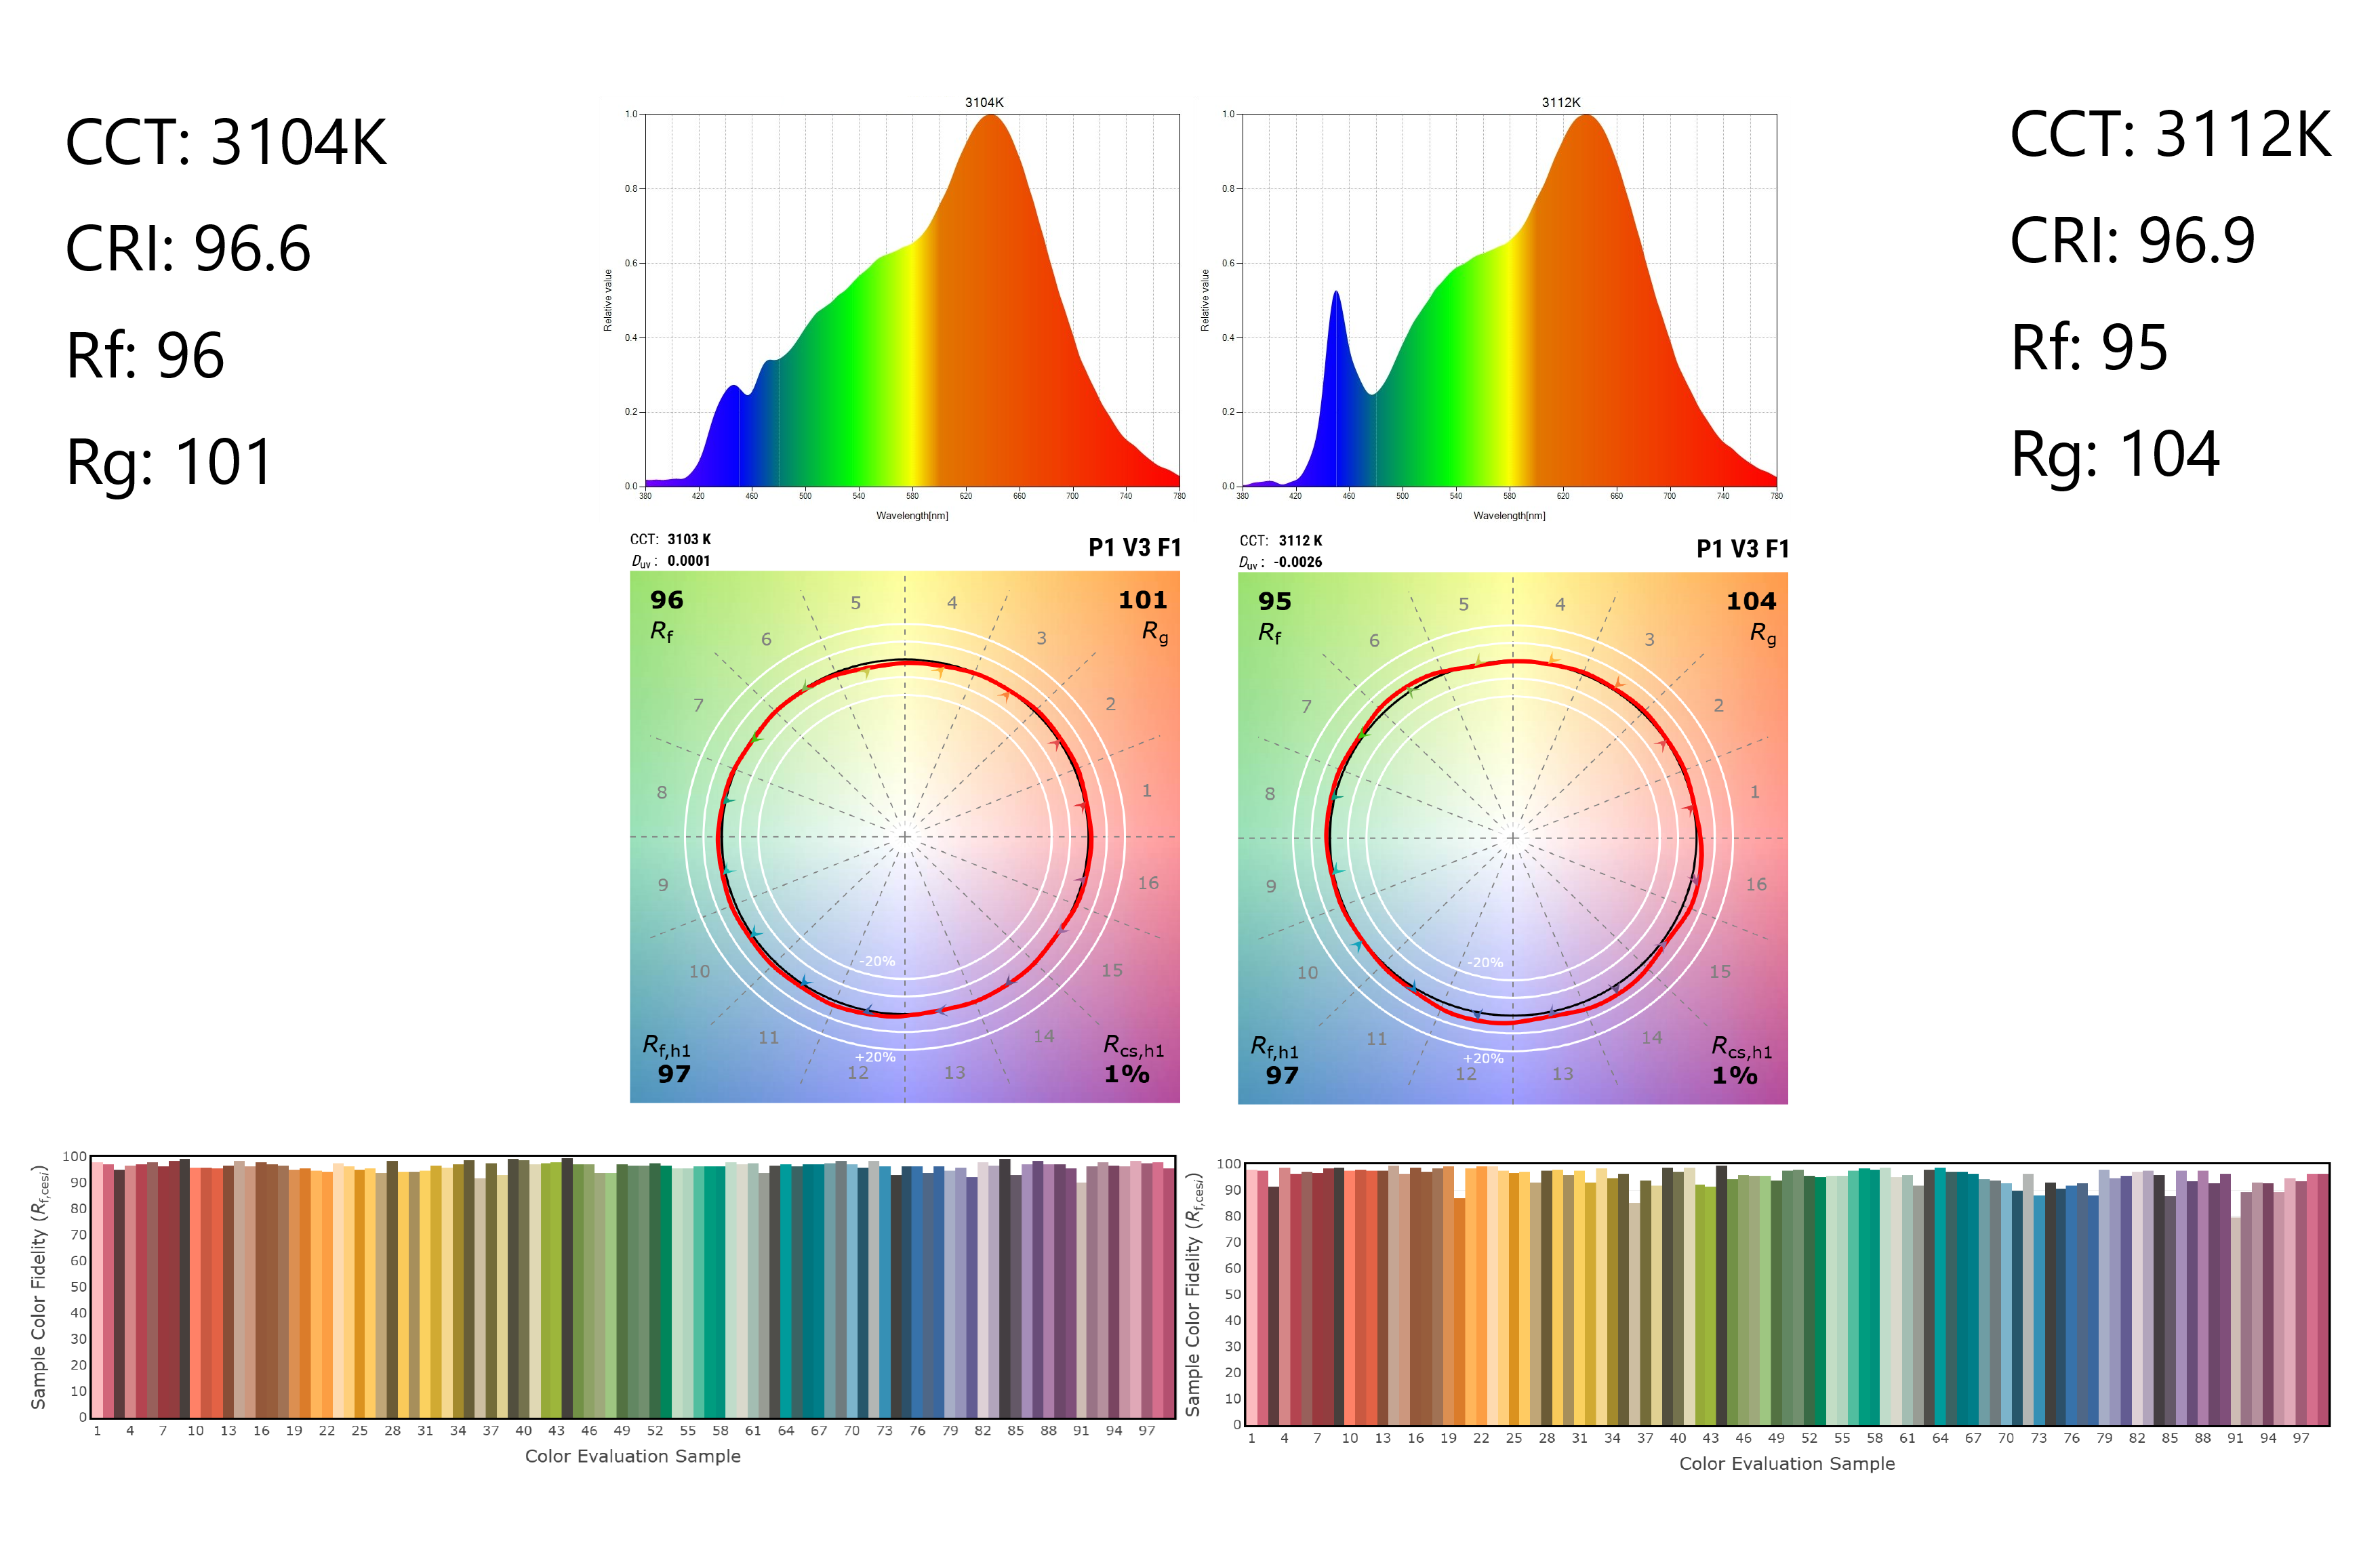
The same CCT does not mean the same spectrum. Even with similar CCT and CRI, differences in SPD can produce different TM-30 results and different color-rendering behavior.
Read more: Color Consistency and Spectral Lighting Design: Why CCT and CRI Are Not Enough.
Fidelity Is Not the Same as Preference
One of the most common mistakes in discussing color rendering is to equate high fidelity with universally “better-looking” light.
They are different concepts.
Fidelity asks:
How closely does the test source reproduce the reference?
Preference asks:
How do people prefer the appearance of colors under that source?
A source can introduce small chroma changes and still be visually preferred in a particular environment.
This may be relevant in:
hospitality
retail
food lighting
residential interiors
On the other hand, intentional color enhancement may be inappropriate for applications where reference fidelity is the primary objective.
Examples include:
color matching
material inspection
some museum applications
scientific or technical evaluation
This is why professional lighting design should begin with the desired visual outcome, not simply a race toward the highest metric.
TM-30 vs CRI
The easiest way to think about the difference is:
CRI
Useful for:
quick screening
legacy specifications
regulatory requirements
familiar communication
basic minimum fidelity
But limited in the amount of information it provides.
TM-30
Useful for:
detailed color evaluation
high-end architectural specification
comparing similar high-CRI products
understanding saturation
identifying hue-specific changes
matching spectrum to design intent
The two can currently be used together.
A professional specification might say:
CRI Ra ≥ 95
R9 ≥ 90
TM-30 Rf ≥ 92
and then use Rg and the complete TM-30 report to further evaluate whether the spectrum matches the intended application.
The specific values should always be chosen for the project rather than copied as universal requirements.
Should Architects Specify TM-30?
For projects where color quality is important, yes.
Not every utility corridor requires a detailed TM-30 specification.
But TM-30 becomes increasingly useful when lighting is interacting with carefully selected materials or when different products must achieve a controlled visual result.
Examples include:
luxury residential
hospitality
museums and galleries
premium retail
restaurants
beauty and cosmetics
high-end architectural interiors
material showrooms
studios
custom fixture development
For these applications, requesting TM-30 data gives the design team substantially more information than CRI alone.
How to Specify TM-30
There is no single universal TM-30 specification suitable for every project.
Start with the design objective.
If Fidelity Is the Priority
Prioritize high Rf and review the Color Vector Graphic for unwanted local deviations.
This may be appropriate for:
artwork
material matching
reference environments
If Visual Preference Is the Priority
Rf remains important, but controlled gamut and hue-specific chroma changes may also be desirable.
This may apply to:
hospitality
retail
residential
food presentation
If Products Must Match
TM-30 should be considered alongside:
CCT
Duv
SDCM
SPD
batch consistency
Excellent TM-30 performance does not automatically mean two fixtures will have the same white point.
For more on this distinction, see our Color-Accurate Lighting Guide.
If the Project Is Extremely Color Critical
Ask for:
complete TM-30 report
SPD
CRI and R9
CCT
Duv
chromaticity coordinates
production tolerances
And whenever possible, evaluate actual materials under physical samples.
Metrics help predict performance.
They do not replace the designer's visual evaluation of the real application.
TM-30 by Application
Hospitality
Hospitality designers often need both excellent fidelity and visually rich materials.
Skin, food, wood, textiles, stone, and artwork all contribute to the atmosphere.
TM-30 can help determine whether a source provides neutral fidelity or intentionally increases chroma in selected regions.
Yuji Lux Tunable White LED combines high color fidelity with dynamic white control for architectural applications.
Retail
Retail is one of the clearest examples of why fidelity alone may not describe the design goal.
Fashion, cosmetics, food, jewelry, and furniture may benefit from different spectral priorities.
TM-30 allows designers to evaluate those effects deliberately rather than choosing a source simply because it has CRI 95.
Museums and Galleries
For artwork, color fidelity may be particularly important.
High Rf and controlled hue-specific deviations provide useful information.
However, museum lighting must also consider illuminance, exposure time, conservation requirements, and the spectral sensitivity of the materials.
TM-30 is an important tool, but it is not the entire conservation specification.
Residential
Premium residential interiors often contain carefully selected wood, stone, fabric, art, and furniture.
TM-30 can help designers evaluate how faithfully these materials will appear and compare competing high-CRI sources that may otherwise look identical on a fixture schedule.
Film and Photography
TM-30 evaluates color appearance for human vision.
Cameras can respond to spectra differently.
For film and photographic applications, additional metrics such as TLCI and SSI may be required together with SPD and practical camera testing.
How Yuji Lux Uses TM-30
At Yuji Lux, TM-30 is not treated as an isolated marketing score.
It is one of the tools used to understand the result of spectral engineering.
The starting point is the Spectral Power Distribution.
By adjusting the underlying spectrum, we can influence:
fidelity
gamut
red rendering
individual hue regions
CCT
Duv
luminous efficacy
melanopic characteristics
Different applications can therefore require different spectral priorities.
For example, Yuji Lux SunWave™ LED is designed around broad-spectrum, daylight-oriented light and publishes TM-30 performance alongside conventional CRI data. Current SunWave specifications list TM-30 Rf/Rg of 98/100.
Our Ultra High Brightness LED combines high output with CRI 95+, R9 above 90, and tight chromaticity consistency for architectural applications.
When standard CCT and CRI targets are not enough, Yuji Lux can also engineer the spectrum itself to control material rendering, chromaticity, and application-specific performance. Learn how Yuji Lux approaches custom spectrum development.
From Color Metrics to Spectral Design
CRI, R9, Rf, Rg, and the TM-30 Color Vector Graphic are all valuable tools.
But they describe the behavior of something more fundamental:
the spectrum.
This leads to an important change in how professional lighting can be specified.
Instead of asking only:
“What CRI is this LED?”
a designer can ask:
What is the Rf?
What is the Rg?
Where are the local chroma shifts?
Are there significant hue shifts?
What does the SPD look like?
What is the Duv?
Does this spectrum suit the actual materials and application?
This is the transition from selecting light by a headline number to designing with spectral information.
Frequently Asked Questions
What is TM-30?
TM-30 is an ANSI/IES method for evaluating light source color rendition.
The current version, ANSI/IES TM-30-24, uses 99 Color Evaluation Samples and provides multiple metrics and graphics describing fidelity, gamut, and hue-specific color changes.
What is the difference between CRI and TM-30?
Traditional CRI Ra averages eight test colors into one general fidelity score.
TM-30 uses 99 samples and provides substantially more information, including Rf, Rg, hue-specific metrics, and a Color Vector Graphic.
What does Rf mean in TM-30?
Rf is the Fidelity Index.
It describes how closely colors under the test source match their appearance under the reference source on average.
Higher values indicate greater average fidelity.
What does Rg mean in TM-30?
Rg is the Gamut Index.
It describes the average change in color chroma compared with the reference.
Values near 100 indicate similar average gamut, while values above or below 100 indicate average increases or decreases in chroma.
Is Rg 100 always best?
No.
Rg near 100 indicates similar average gamut to the reference, but the ideal result depends on the design objective.
Some applications prioritize reference fidelity, while others may benefit from controlled chroma enhancement.
Is Rf 100 always the best lighting?
Not necessarily.
Rf 100 represents extremely high fidelity to the reference.
But fidelity does not automatically equal preference.
A spectrum should be selected according to the intended visual result.
Does TM-30 replace CRI?
TM-30 provides a much more complete description of color rendering, but CRI remains widely used in product specifications and regulations.
During the industry's transition toward newer color-quality metrics, it is useful to report both.
How many colors does TM-30 use?
TM-30 evaluates 99 Color Evaluation Samples.
These cover a significantly broader range of colors than the eight samples used to calculate traditional CRI Ra.
What is a TM-30 Color Vector Graphic?
The Color Vector Graphic shows how different hue regions change under the test source compared with the reference.
It can reveal increases or decreases in chroma and shifts in hue that cannot be seen from Rf or Rg alone.
Can two lights have the same CRI but different TM-30 results?
Yes.
Two sources can have the same CCT and CRI but different spectral power distributions, Rf, Rg, and hue-specific color behavior.
Is TM-30 useful for architectural lighting?
Yes.
TM-30 is particularly valuable for hospitality, retail, museums, galleries, premium residential, restaurants, showrooms, and other projects where the appearance of materials is important.
Need Help Evaluating a Lighting Spectrum?
Yuji Lux works with architects, lighting designers, manufacturers, and integrators on projects where color rendering and spectral performance matter.
We can provide and evaluate:
TM-30 data
SPD
CRI and R9
chromaticity and Duv
color matching
full-spectrum lighting
Tunable White
custom spectral targets
Explore Yuji Lux Lighting Solutions