CCT and CRI were never designed to guarantee visual consistency across a complete architectural lighting system. They describe individual light sources in isolation — not how those sources behave together in an architectural environment. For premium projects, that distinction is everything.
A lighting exhibition stand showing two fixture types installed in the same space — two linear fixtures and an accent spotlight. Despite being nominally the same warm white, the tint difference is clearly visible: the linears read pinkish, the spot greenish. Right: 1976 CIE chromaticity diagram (u', v') illustrating the white chromaticity region and the possible directions of chromaticity shift induced by the final optical system. The tints visible in the photograph suggest the two sources sit on opposite sides of the blackbody locus — a textbook case of cross-category Duv mismatch:
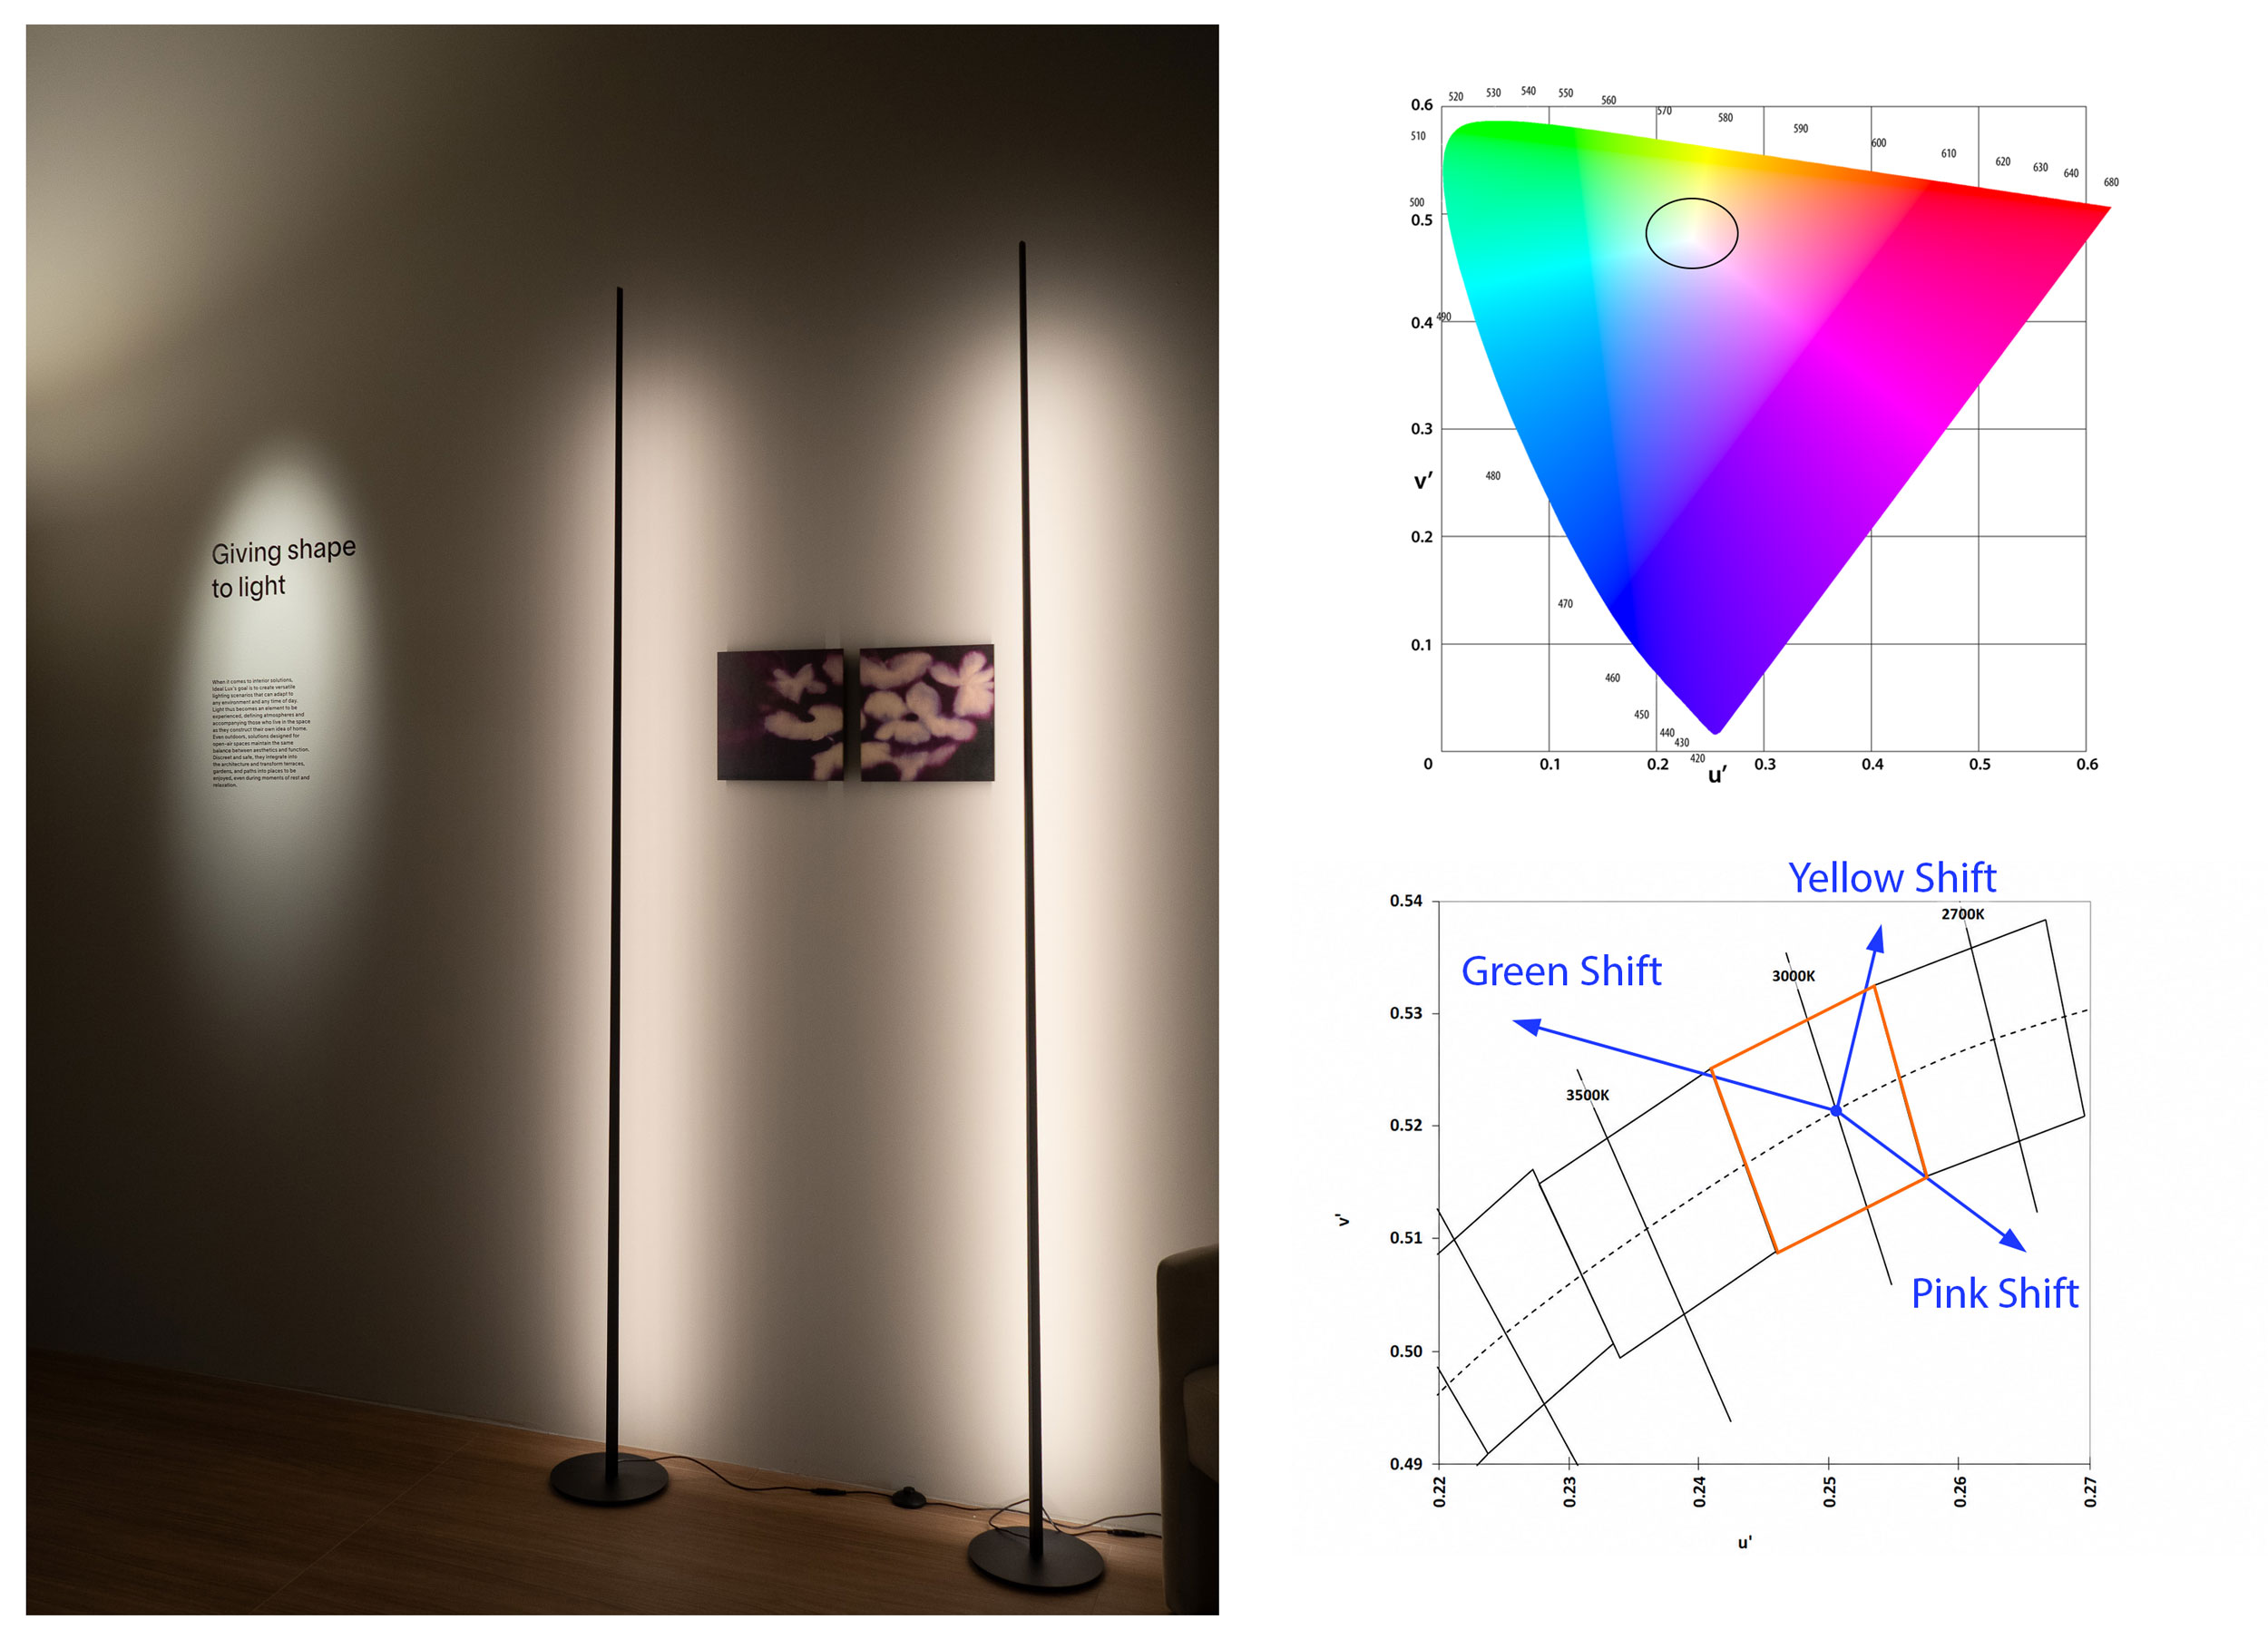
The image above shows what happens when lighting quality is treated as a secondary consideration — regardless of how much care went into the design around it. Not because of fixture form or light distribution, but because of something subtler: a color mismatch between LED sources that the eye registers before the mind names it. One fixture reads greenish, the other pink. To understand why this happens — and how to prevent it — we need to look at what standard metrics don't capture.
Beyond CCT and CRI: What Standard Metrics Don't Capture
CCT and CRI are useful, but they describe only part of the story. They tell us something about an individual light source under defined test conditions, but they do not fully predict how that source will behave once installed — relative to other sources, inside a specific optic, behind a diffuser, at operating temperature, or within a real material environment.
One of the missing parameters is Duv (Delta u,v). Duv describes where the white point of a light source sits in relation to the blackbody curve: above it, the light may read slightly greenish; below it, it may appear more pinkish or rosy.
Human vision can be highly sensitive to these tint shifts. Small differences in Duv may become especially visible when multiple light sources are used side by side — for example, LED strips and luminaires within the same space. In many practical situations, a small Duv mismatch can be more visually disturbing than a modest difference in CCT, because chromatic adaptation often allows us to tolerate small CCT variations more easily than opposing tint shifts.
For a detailed breakdown of how Duv and CCT tolerances work in practice: Why Color Accuracy in Lighting Matters More Than You Think.
But even Duv is not the full picture. To understand how light will actually perform in space, we need to look at its Spectral Power Distribution (SPD) — the distribution of energy across the visible spectrum. SPD explains how a source renders colours, skin tones, natural materials and architectural finishes. It also reveals aspects of light quality that CCT and CRI cannot show: how much short-wavelength energy is present, how the spectrum may affect circadian response, visual comfort, alertness and the biological perception of day and night.
In other words: CCT tells us how warm or cool the light is. Duv tells us its tint direction. SPD shows what the light is made of — and why its visual and non-visual effects can be so different, even when the label says the same CCT and CRI.
The Cross-Category Binning Problem
To maintain consistency within a single product line, reputable manufacturers use LED binning — sorting LED packages by chromaticity into defined tolerance zones. The industry standard for this is MacAdam ellipses (SDCM, Standard Deviation of Color Matching): elliptical regions on the CIE chromaticity diagram within which color differences are imperceptible or barely noticeable to the human eye. A 1-step or 2-step MacAdam ellipse is considered visually uniform; a 3-step bin is acceptable for most commercial applications; beyond that, differences become clearly visible.
The problem is that MacAdam ellipses define a zone of tolerance — not a direction. A fixture binned to 3-step SDCM can sit anywhere within that ellipse: above the blackbody curve, below it, or on it. Two products can each be within their own 3-step bin and still end up on opposite sides of the blackbody curve — one with positive Duv, one with negative. Both are technically within spec. Together in the same space, they look mismatched.
Furthermore, binning is applied per product, per manufacturer, under laboratory conditions. There is no cross-category standard that ensures a spotlight from one bin and a linear strip from another will share the same white point once installed. The ellipses control spread within a product line — not consistency across an architectural environment.
This is compounded by conflicting engineering objectives across fixture categories. Different fixture categories are often optimized according to different engineering priorities. Some high-output COB sources may be tuned for efficacy, thermal performance or optical punch, while linear LED strips may be selected or binned for a cleaner perceived tint. As a result, two product categories that look acceptable on their own can still land on different sides of the blackbody curve once installed together.
But even sourcing LED packages from the same chromaticity bin, reel, or lot does not guarantee visual consistency across different product types. The final color of light is shaped by every element in the assembly:
Drive current and thermal conditions — different fixtures run LEDs at different currents and manage heat differently, shifting phosphor output
PCB design and thermal path — board layout and heatsink efficiency affect junction temperature, which shifts chromaticity in real time
Optics, lenses, and diffusers — each absorbs and scatters specific wavelengths, altering the SPD before light reaches the surface
Diffuser thickness and material — even small variations in polycarbonate density produce measurable color shifts
None of these variables are captured by standard binning tolerances — which is why component-level consistency alone is rarely sufficient for cross-category color matching.
Flawless Results Require System-Level Spectral Design
Yuji Lux spectral design tool: custom SPD composition by wavelength, with real-time CIE chromaticity mapping and optical parameter output:
Solving cross-category color inconsistency requires a fundamental shift in how consistency is defined and verified. Matching LED packages at the component level is not enough — color consistency must be engineered and confirmed at the final system level: the complete optical assembly, at operating temperature, in the actual configuration it will be installed.
This is what spectral lighting design means in practice.
The process starts by defining a target chromaticity point — typically anchored to the primary fixture category, such as the COB downlight — and working backwards. Every other component in the visual field is then engineered to hit that same target after passing through its specific optics, diffuser, and thermal conditions.
This involves three interdependent steps:
1. Chromaticity mapping across assemblies
A comprehensive mapping of how specific diffuser materials, reflector geometries, and aluminum channel profiles shift the SPD of a given LED package. What measures correctly in a laboratory bin will behave differently inside a frosted polycarbonate extrusion at operating temperature.
2. Predictive pre-compensation
The linear LED component is engineered with a calculated offset relative to the target. The goal: the strip hits the chromaticity target after passing through its specific optics and reaching thermal equilibrium — not before.
3. Custom phosphor blending
Standard phosphor ratios are optimized for efficacy, not cross-category Duv alignment. Matching a COB spotlight to a linear profile in the same visual field requires synthesizing LED packages with a corrected spectral curve from the component level up.
The result is a lighting system where visual coherence is not assumed — it is engineered, verified, and repeatable across production batches.
How Yuji Lux Approaches Color Consistency
Yuji Lux treats color consistency as a system-level design task. Instead of evaluating LED strips, profiles, diffusers, drivers and optical accessories in isolation, we consider how each component affects the final light output once assembled, powered, diffused and installed.
For architects and lighting designers working on high-end residential, museum or luxury retail projects, this helps shift the specification process from nominal values to measurable performance: SPD data, Duv targets, diffuser effects, thermal behavior and cross-category consistency.
Yuji Lux works directly with design teams to define chromaticity targets, evaluate complete LED assemblies and support predictable visual results across linear lighting systems and related architectural lighting components.
If your project requires consistent white light across different lighting elements, contact Yuji Lux to discuss the right spectral strategy.
Cover Image: CIE-1931 diagram, Paulschou & Fuzzypeg, Wikimedia Commons, CC BY-SA 3.0.